Measure what happens after publishing.
Understand how many sessions start, where interaction appears, what gets completed and how each audience responds, without reducing the experience to a play count.
Basic dashboard and export available in beta.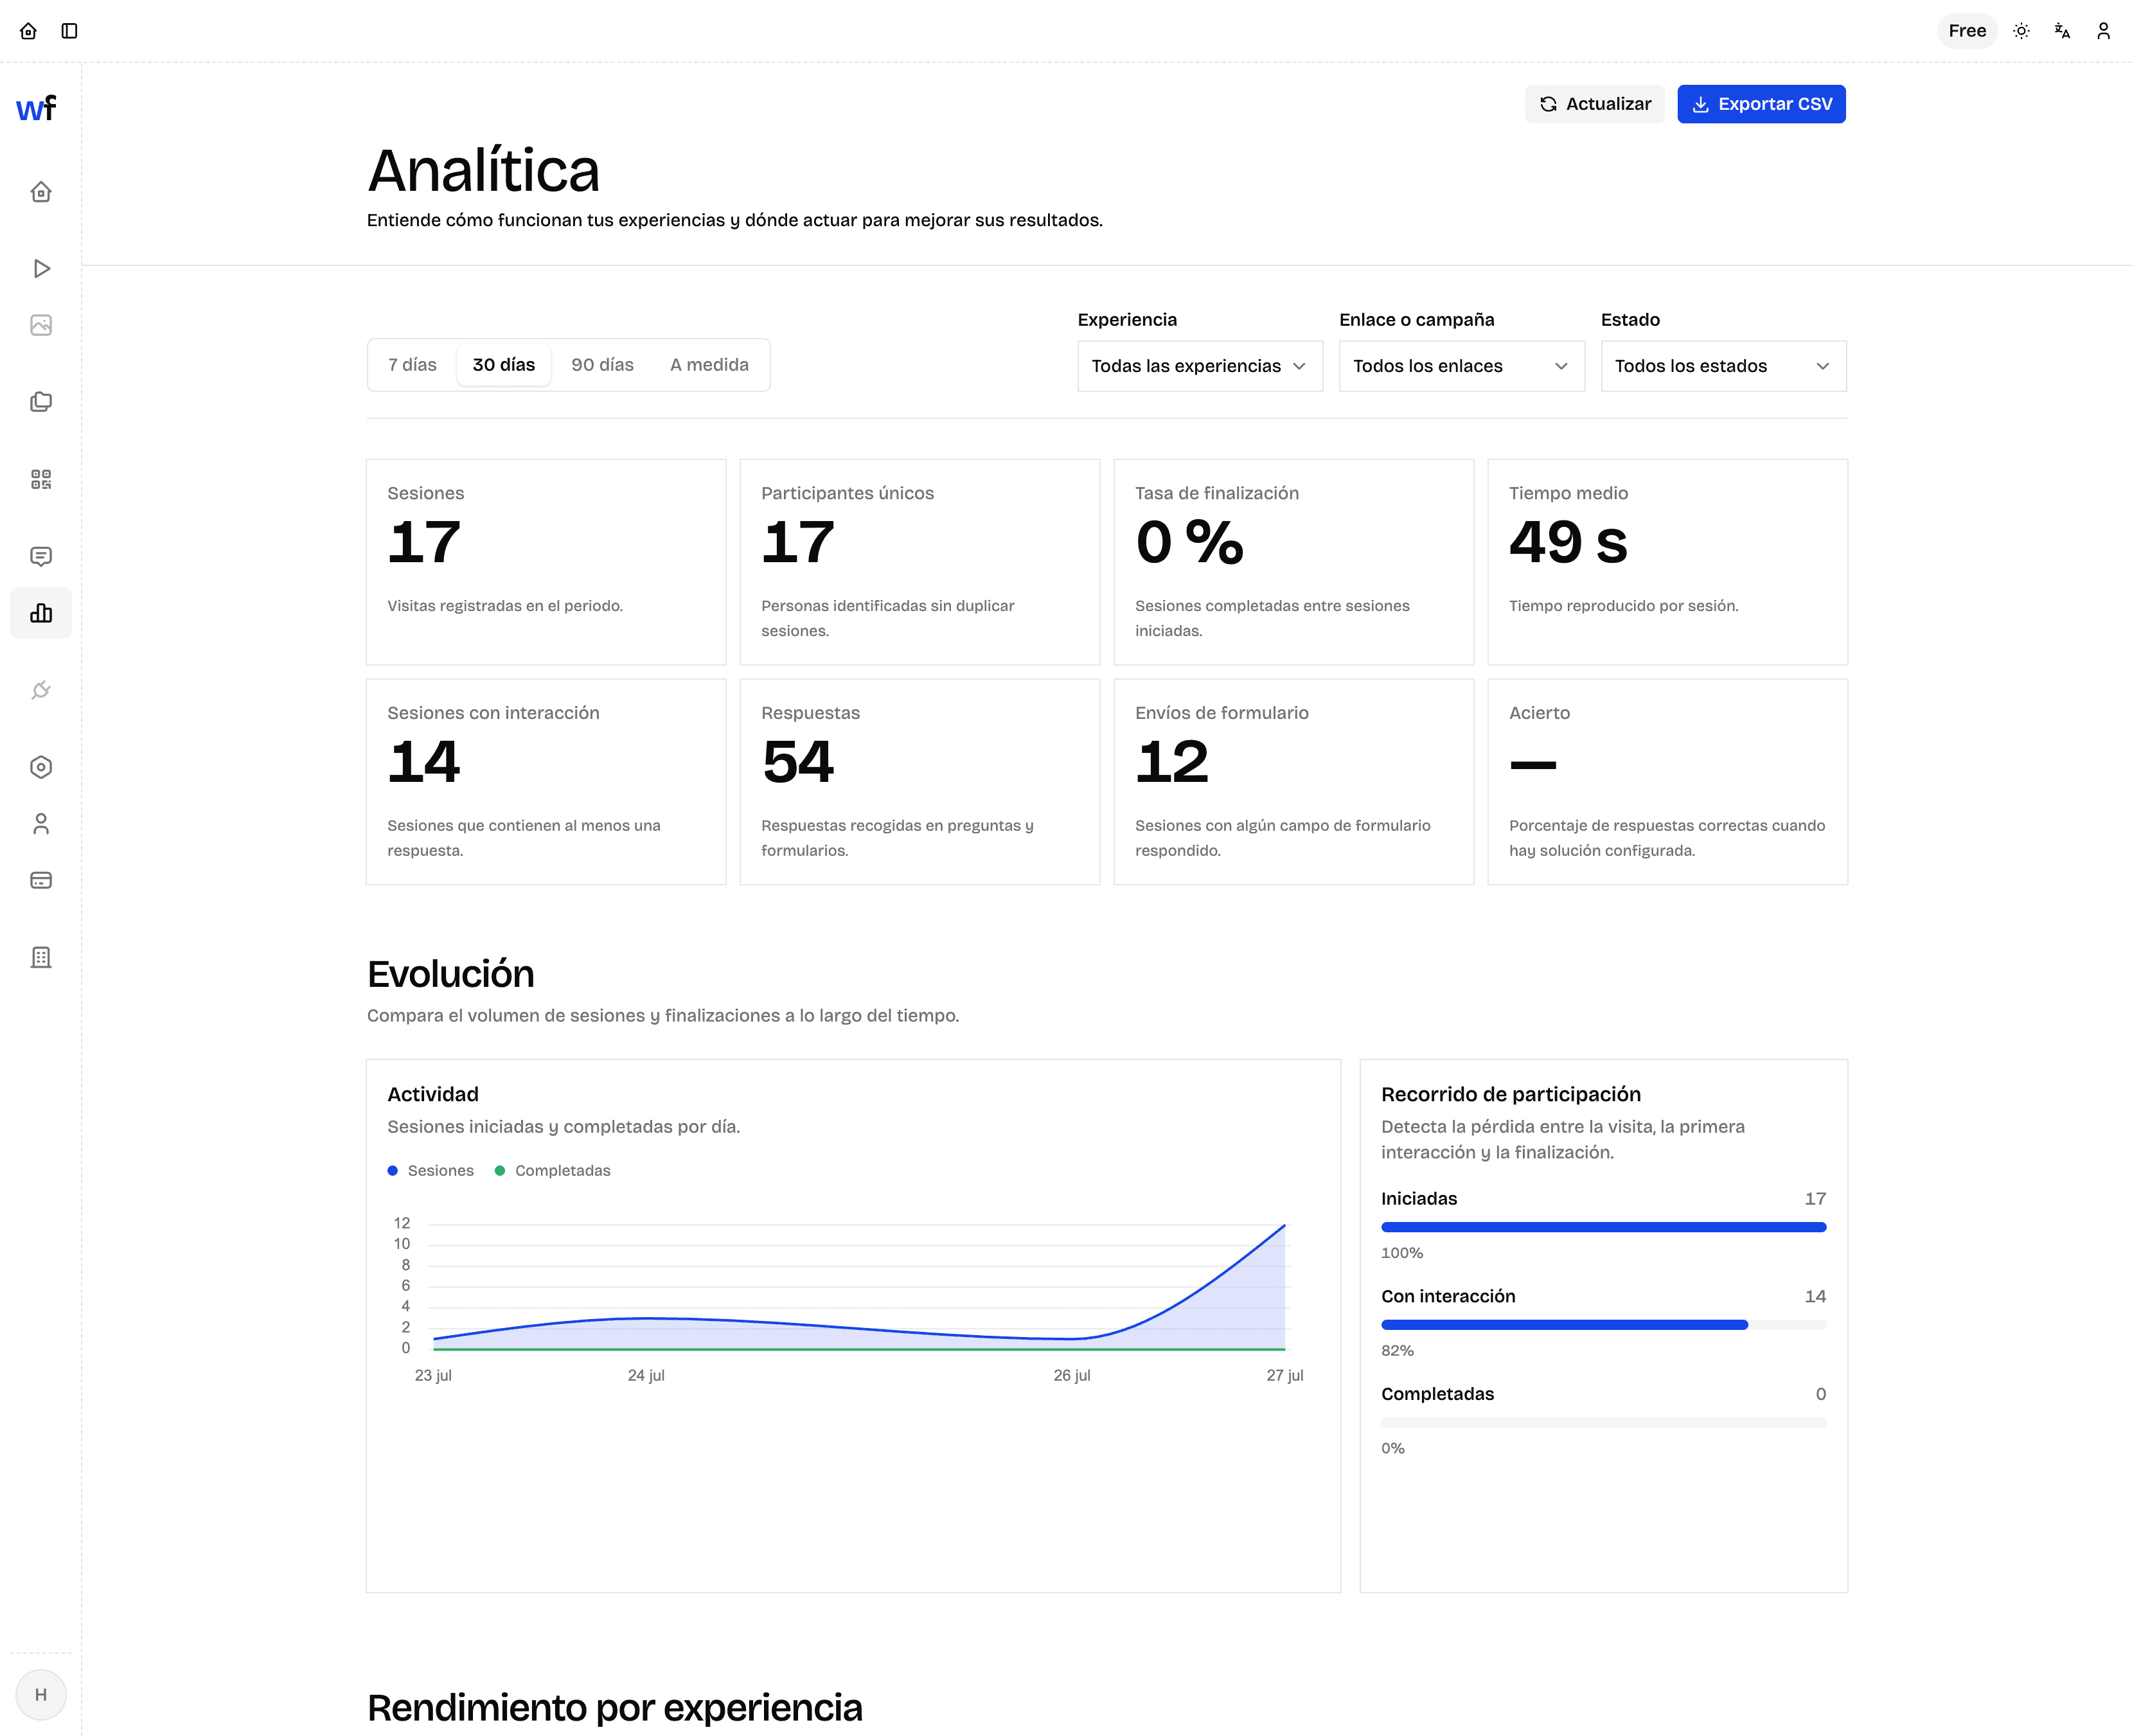
A useful reading starts with clear definitions.
The dashboard combines volume, participation and outcome so every number has operational context.
From start to completion, without mixing signals.
The funnel separates entry volume, effective participation and completion of the experience.
Sessions started
The baseline used to calculate participation and completion.Sessions with interaction
They contain at least one response within the experience.Sessions completed
They were submitted or reached at least 98% of the content.Compare behaviour without losing context.
Current visualisations help locate volume changes, differences between experiences and response patterns.
Filter before interpreting.
The overview, charts and export share the same period and conditions.
- PeriodLast 7, 30 or 90 days, or a custom range.
- ExperienceAll experiences or one specific experience in the workspace.
- Link or campaignNarrow the reading to an entry point within one experience.
- StatusCompleted, incomplete or all sessions.
Take the filtered detail to CSV.
The export uses the same visible scope and provides a long format prepared for external review.
Measure whether supporting content is actually used.
The public page contributes events for chapters, transcript, resources and the configured final action.
- Chapters, transcript and resourcesThe dashboard shows how many distinct sessions used each aid.
- Sessions, not clicksOpening the same resource several times within one session does not inflate the reading.
- Objective only when it existsThe rate appears only when the creator configured a final action; without a declared objective no conversion is invented.
Limits are part of the metric too.
The beta states how it aggregates, when it shows a sample and which sources support each block.
Up to 5,000 sessions
If the period exceeds the limit, the dashboard warns that the reading is sampled.Visible time zone
Activity is grouped using the browser time zone.Documented completion
A submitted session or one with at least 98% progress counts as completed.Bounded sources
The beta combines operational responses and supporting events without downloading complete collections to the browser.Basic analytics in beta; advanced depth later.
The current dashboard already supports reviewing and exporting activity. Capabilities that require complete instrumentation remain planned.
Operational reading
Advanced analytics
Common questions about analytics.
Definitions and limits for interpreting the dashboard correctly.
Does one session equal one person?
No. One person can start several sessions. The dashboard presents sessions and unique participants as separate metrics when a stable identity exists.
When is a session considered complete?
When it was submitted or reached at least 98% of the content. This definition is applied consistently to the overview, charts and CSV.
Does Weform always show a conversion?
No. The objective only appears when an experience configures a final action. Without that destination, a conversion rate would not have a valid meaning.
What happens when there are more than 5,000 sessions?
The query remains bounded and the dashboard visibly states that the results and CSV are based on a sample.
Does the browser download every response?
No. Aggregates are calculated in the backend and the reading is limited to the authorised organization, period and filters.
Publish, observe and decide with context.
Start with one video experience and use its signals to improve the next journey.Create an experienceThe platform for creating, publishing and measuring interactive video experiences.